Improved understanding of energy balance in cows
and live on Freeview channel 276
While, most dairy cow studies undertaken at AFBI Hillsborough involve relatively small numbers of cows, and normally seek to answer a single question, if we combine data from multiple studies representing a range of conditions, we are able to examine issues that may not be possible within any one individual study. Recognising the research potential of this approach, AFBI have pulled together performance information from dairy cow studies conducted over the last 30 years into a single set of data, and are using this to gain a better understanding of a range of key factors which drive milk production, including energy balance.
Exploring energy balance
Cows normally enter a period of negative energy balance in early lactation. This is due, in part, to the milk yield potential of dairy cows having increased, while their ability to consume sufficient food to support this extra milk has not increased at the same rate. During periods of negative energy balance the cow uses her body fat reserves to sustain her milk production, and this is reflected in a loss of body condition. Excessive negative energy balance (cows getting very thin) can lead to health problems and poor fertility.

Advertisement
Advertisement
Within a recent DAERA funded project (NutriGen), which was undertaken in partnership with University College Dublin and Teagasc, scientists at AFBI have combined and analysed individual cow results from 27 experiments (involving 1,321 cows). This information has been used to examine factors influencing the energy balance of cows, and to examine if we can use milk fat-to-protein ratio as an indicator of energy balance.
Outcomes
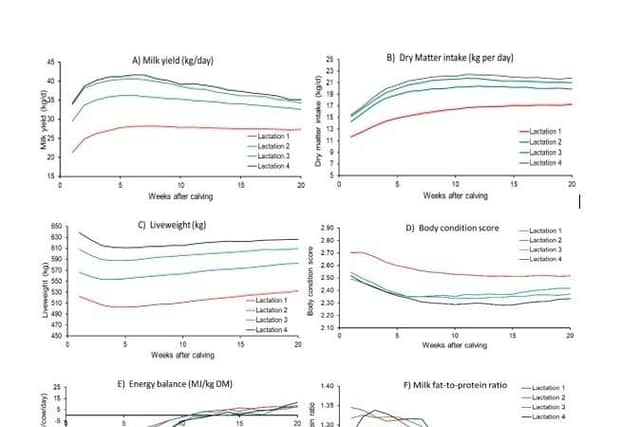
Figures 1A – 1F (see Figure 1) demonstrate how milk yield, dry matter intake, liveweight, condition score, energy balance and milk fat-to-protein ratio change over the first 20 weeks of lactation for cows during lactations 1 - 4. Milk yields (A) normally ‘peak’ around 5 – 7 weeks after calving, while intakes (B) do not normally peak until 10 – 13 weeks after calving. This difference in the timing of peak milk yields and peak intakes helps explain why cows enter negative energy balance. However, increasing the quality and nutrient density of the diet can allow cows to have higher nutrient intakes, and as such, reduce energy balance to some extent. As expected, both milk yields and intakes increase with increasing lactation number.
Liveweights (C) normally decrease during the first 5 weeks after calving, before beginning to increase again. However, body condition score (D) normally continues to decrease until approximately 10 – 15 weeks after calving. Similar to body condition score, the energy balance curves (E) show that cows remain in negative balance until approximately 10 – 15 weeks after calving. This highlights that body condition score is a much better indicator of energy balance than liveweight. Conducting body condition scoring can provide farmers with useful information to help manage the energy status of their herd. Peak negative energy balance is normally observed at week 2 – 3 post calving, while older cows experience a more negative energy balance than younger cows. Figure F demonstrates that the mean fat-to-protein ratio of milk is highest after calving and decreases during lactation.
While these results help us understand the relationships between performance and energy balance of the ‘average cow’, there is of course no such thing as an ‘average cow’. To manage individual cows accurately, we need to have a better understanding of how individual cows are performing.
Milk fat-to-protein ratio
Advertisement
Advertisement
It is difficult to measure a cows energy balance, even on a research farm. While regular body condition scoring can provide a good indication of the energy status of individual cows, body condition scoring can be time consuming, and most farmers do not do this regularly. Consequently, there is a research interest in identifying alternative indicators of a cow’s energy balance. One indicator that might be used is the fat-to-protein ratio of milk. This ratio is determined by dividing the fat % of milk by its protein %. For example, if a cow produces milk with a fat content of 4.2% and a protein content of 3.3%, the milk will have a fat-to-protein ratio of 1.27.
Milk fat-to-protein ratio is already used by nutritionists as an early indicator of nutritional problems, with the ratio reflecting an ‘imbalance’ in milk fat and protein levels. For example, when cows mobilise body fat in early lactation, some of this fat ends up in the cow’s milk, and her milk fat % increases. Similarly, when cows are deficient in energy, milk protein levels tend to fall. Cows with a high ratio may be at an increased risk of ketosis. Cows with a fat-to-protein ration of greater than 1.5 are assumed to be ‘metabolically at risk’.
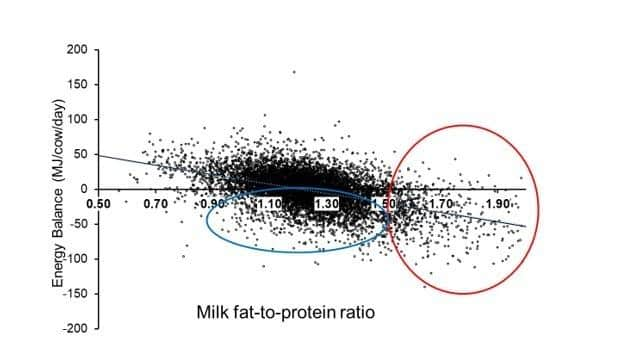
The relationship between energy balance and the fat-to-protein ratio of milk was examined within the NutriGen project to identify if this ratio could be used to predict the energy balance of individual cows. This relationship is presented for first lactation cows in Figure 2. Each dot on the figure represents an individual cow for which we had information on milk composition and energy balance.
The figure clearly demonstrates that as energy balance becomes more negative (i.e. cows are mobilising more body tissue), the fat-to-protein ratio of milk increases. Cows with a fat-to-protein ratio greater than 1.5 (the dots in the red circle) almost all have a negative energy balance. Thus we can be reasonably confident that cows with a fat-to-protein ratio greater than 1.5 are metabolically challenged. However, there is also much variation within the data. For example, many cows with a fat-to-protein ratio between 1 and 1.5 were also in negative energy balance (the dots in the blue circle), while a fat-to-protein ratio within this range would not necessarily be considered to highlight cows that are ‘at risk’. Based on this analysis, milk fat-to-protein ratio alone cannot be used to accurately predict the energy balance of individual cows. Instead, as currently used by nutritionists, it has a role as an early indicator of an imbalance in nutrition, especially when considered within the context of other diet and herd factors.
Conclusions
Advertisement
Advertisement
Researchers at AFBI are increasingly combining results from multiple studies to help understand complex biological systems. The current research project adopted this approach, and has highlighted why cows experience negative energy balance, that body condition score is a better tool for monitoring energy balance than liveweight, and that fat-to-protein ratio is strongly related to energy balance. However, the study has also demonstrated the limitations of using fat-to-protein ratio to predict the energy balance of individual cows.